Performancing Metrics

Performance blog: Performance Engineering
Showing posts with label Performance Engineering. Show all posts

Monday, August 29, 2011

Derive Concurent Users using Little's law

The below real time example will help in deriving the concurrent users using Little's law. In the below example

  • Adjusted Hits, Median Think Time derived from production logs for one hour period.
  • Avg RT/Step  is the Target Response SLA required to met under load
  • No of Steps is no of transactions per business flow
  • Concurrent Users is derived using little's law Throughput* (Avg RT+ Think Time)


@2011, copyright Vamsidhar Tokala

Wednesday, July 14, 2010

How to determine the speed of network during a load test using LoadRunner

Sometimes problems in the Network can impact load test results. It is important to monitor the rate at which data is received from the server in a Network.


LoadRunner can help you in determining the bandwidth used during a load test. Web Page Diagnostics Graphs in LoadRunner provides drill down analysis across different layers.

Network bandwidth by a Component = Component Size/ Component Receive Time

Component Receive Time is the Time to transfer between the first byte to the last byte arrives from the server and Component Size is the size of component downloaded from the server.

In the below Example Network speed during the test is 263.249/1.132 = 232 KB/sec. This speed may slight vary from component to component and also based on Load Generators used for the test

Web page diagnostics

Monday, November 23, 2009

Little's Law

In continuation with my earlier post “Decoding concepts of Performance Engineering” I will try to derive Little's law in this post for better understanding

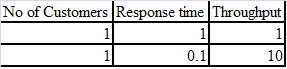
Consider a steady state system which has only one user and sends the requests at consistant intervals and response time of the requests were observed to be 1 sec.

No of Customers in the System = 1
Response Time = 1 sec (Service Demand)
So Maximum Throughput = (1/Service Demand) = 1 Request/Sec (Based on Utilization Law)

It implies average number of customers required being in the system to achieve 1 request/ sec with an average response time is 1 sec is 1 user

Similarly assume if the response time of the system is 0.1 Sec

Response time = 0.1
Max Throughput = 1/Service Demand = 10 requests/Sec

So One single user can simulate max of 10 requests/sec with a average response time of 0.1 sec

Little's Law


Average Number of Customers = Response time * Throughput

Little’s Law states that average number of customers in a system is equal to product of throughput and response time.

Tuesday, October 6, 2009

End to End Performance Test Approach - Part 1

The purpose of this post is to show end to end approach for implementing performance testing. This document covers different phases of performance testing and approach to follow for successful performance test

Requirement Gathering:


During the Requirement Analysis phase it is important to assess and understand the nature of the application and the environment in which testing and monitoring should be performed. In addition to this, identify the resource requirements and plan based on the application. Also the existing Non-functional Requirement (NFR) would be discussed and understood by having discussion with the Design & Development team with respect to SLA’s, number of concurrent users and volumetric information. Also, wherever there is any specific information lacking, the same should be discussed with Design & Development team to reach a mutual agreement and definition of the same.

Performance team should also analyze system volume metrics over specified period of time in production to identify load patterns, work load behavior, Peak user load etc in the system.


Identify the peak period during volume metric analysis and also transaction arrival rate along with the user concurrency to simulate in the test environment. Create a workload model for the peak load with transaction mix along the user load based on the volume metric analysis. This will also help us in identifying the types of tests required for testing the application. Below is a sample template of the workload model for deriving the peak load.

Workload Model


Saturday, October 3, 2009

Decoding concepts of Performance Engineering

In most of the situations we have a tendency of using the formula’s without understanding the concepts behind it, because of which we may not be able to apply the laws correctly where it is required. 

The following example will help in understanding the some of the performance rules

A system was subjected to 10 requests in a span of 2 min and got the responses for all requests during this period and Utilization of the system during the time frame was observed to be at 50%.


Request Arrival rate for that system is  10/2=5 requests/Min
Throughput = 10/2 = 5 Responses/Min


in the above example, system utilized 50% of its resources for serving 5 requests. For Each request, it consumed 50%/5 of system resources. This value is called service demand of that resource


From the above example the formula for service demand can be derived as below
Service Demand  =Utilization/Throughput. 
similarly Utilization = Throughput * Service Demand This is also called utilization Law


The utilization of a resource is equal to the product of the throughput of that resource and the average service demand at that resource.